About P R Guruprasad...
He now runs his own Educational Publishing Firm 'Ragaleela Publications' along with his brother [a marketing professional]. Guruprasad takes care of the Firm's K-12 Education division which is involved with curriculum, teacher development and education administration materials.
You can learn more about Guruprasad and his work by visiting his web site www.geocities.com/prg552000/
After doing his BSc and BEd Degrees from the Univ. of Madras, he entered teaching. He has taught K-12 English, Maths, Science, Physics and Chemistry. He has worked as teacher, principal and education officer in school systems in India, S Asia and Africa. He has also worked as education officer in Macmillan India Limited where his career responsibilities included conducting teacher development workshops, offering editorial assistance and developing curricular support materials.
professional_homepage.html or his company website www.raagaleela.com.

 Teacher Feature...
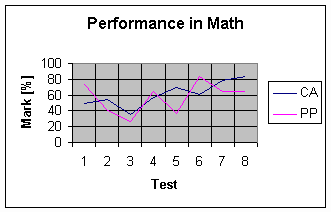
Analysis of Whole Class Performance in Tests and Exams: by Panamalai R Guruprasad Pupil: Sir, if we do well, we go to a higher class at the end of every year; but you stay in the same class. Why? Teacher: I don't have tests! We are all aware of the importance of tests and exams in the academic life of a classroom. There are numerous strategies to analyze whole class performance based on individual scores obtained by pupils. Many of these employ statistical techniques and are highly reliable. We live in a world today filled with contrasts. K-12 is no exception. In developing countries, there are situations where teachers are either not very trained to use statistical methods or fear using them ['I never did any math or statistics beyond Grade 10 myself']. Moreover assessment boards usually do not attach any importance to such methods ['Marks and ranks are the most important in tests and exams']. How can a teacher assess whole class performance in any test or exam without using statistics as a tool? This article illustrates one method that I have tried with my staff. This method is certainly not 100% perfect, but is adequate enough to have a bird's eye view on the whole class performance for a later follow up. Let us consider math teaching learning in a classroom X in a school Y in a particular academic year. Our problem is to assess how the class has been doing in the subject year round. Step 1: In our work, we begin with two essential parameters: Class Average [CA] and Pass Per Centage [PP]. These are computed as follows: Class Average = Total number of marks obtained by the students [in the class] / Total number of students who took the test or exam Pass Per Centage = (Number of students who have obtained pass mark / Total number of students who took the test or exam) X 100% Suppose the following data documents the CA and PP for each test taken by students in that class:
Step 2: Now we need to represent the above data graphically; the graph will be as follows:
The graph can be hand-drawn [some amongst my teaching staff with 'itching' fingers relished the exercise] or made using Excel and the like. Step 3: The two curves in the graph can be a wealth of information for us to explore and act. The diagram above tells us the following: In the Test 1, the PP is high at 74% whereas the CA is just mediocre [50%]. This means that most children have passed the test but not with high marks. A situation which warrants individual attention to most children. In test 5, we see that only 37% of kids have passed but the CA is a high 70%; in other words this minority students of the class have 'pulled' the CA to 70%. Very few students have obtained very high marks leaving others near the bottom line. The majority have a problem. This pass-fail discrimination is a clear warning sign for follow up. Test 3 figs. Show both PP and CA low. Majority have failed and with low marks. The situation is very grim and the teacher needs drastic follow up before it is too late. Scope for further exploration and follow up are immense with possible resultant improvement in quality [curriculum, teaching methods as well as assessment] We can use CAPP technique in a wide range of situations. It can be used as a whole class performance indicator by translating all CAs and PPs [meant for different tests and different subjects] into single units per test. Such documentation can be used to compare (i) performance quality of any one school in different periods of time (ii) Performance quality of different schools in a given period of time etc. for positive competition. In fact I have had the pleasure of using CAPP in several more ways to improve quality standards at subject level, departmental level and whole school level. When the quality of learning improves due to effective implementation of CAPP, perhaps people tell you, 'Hats off!'; wouldn't it be more apt to say 'CAPPs off'?
Browse the Math Teacher Chatboard at Also look through the latest posts in the Middle School Center.
|