|
|
|
 |
| Teachers.Net Gazette Vol.6 No.2 | February 2009 |
Subscribe for free home delivery |

|

The Heart of Mathematical Thinking Valentine's Day math activities are often conducted only at the lowest levels of Bloom's taxonomy and involve nothing more than counting and graphing candy hearts. This lesson goes way beyond to involve students' in higher levels of thinking! | ||
| by Laura Candler www.lauracandler.com New contributor to the Gazette February 1, 2009 |
||
|
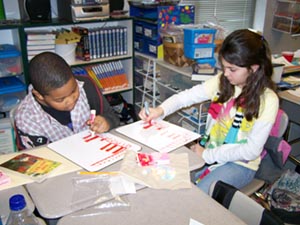
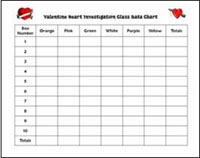
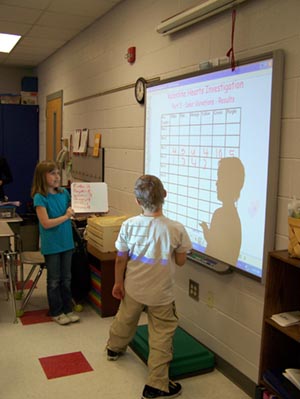 Why not take a few days in early February to enjoy an activity that involves the “heart” of mathematical thinking? In doing so you’ll engage your students’ minds as well as their taste buds! Valentine Hearts Investigation Objective: To analyze data and make predictions based data analysis Materials for the Class: 11 small boxes of valentine candy hearts, balance scale, graph paper or computer access, 1 project folder for each student, Valentine Hearts Investigation activity page, Class Data Chart, Valentine Hearts Smartboard Directions (optional - available at www.lauracandler.com) Time Needed: 2 to 4 class periods Procedure: Prepare Materials Duplicate 1 copy of the student activity page for each student. You will be examining 10 boxes of candy, so you should pair students or have them work in groups of three so someone will be responsible for each box. These directions assume that each student has a partner although this might not be true in all cases. Use a permanent marker and number the boxes 1 through 10 to avoid confusion later. 2. Introduce the Investigation Introduce the investigation by asking, “How similar and different are boxes of valentine heart candies?” Ask if they think it’s possible to make accurate predictions about the weight and number of candies an unopened box of the same brand. Discuss their ideas. If you are using the Smartboard version of the activity, use it to guide you through the remaining steps and have students record their results on their worksheets. If you are not using the Smartboard directions, talk your students through each step one at a time. 3. Distribute Materials Give one box of candies to each pair of students, but tell them not to open it. If you plan to allow the students to eat the candies later, make sure that one person in each pair washes their hands and is the only one to touch the materials after the box is opened. Each student needs a copy of the activity page, and each student should be responsible for recording data during the activity. It would also be helpful to give each student a project folder in which to store their materials for this investigation. 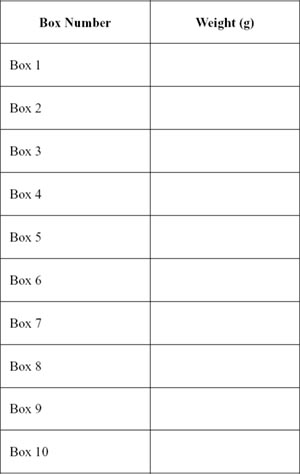 Ask students how they could find out the weight of each box. After discussing it with a partner, many will say that the weight is on the box! Challenge them to find out if the weight is accurate, and if it includes the box or just the candy inside. Also, the weight might be listed in ounces, but they will be trying to determine the weight in grams. Ask students to record their predictions for the weight in grams on their worksheet, and then let each pair weigh their boxes. Create a class chart of the results such as the one shown at right. What kind of graphs could be used to display this data? Have students discuss this with a partner, and then talk it over as a class. Appropriate choices would be a bar graph, a picture graph, or a line plot. However, line graphs and circle graphs would not be appropriate for this type of data. Ask students to choose one type of graph and create a graph of the class results. They could do this on graph paper or use a spreadsheet or graphing program. Work together to figure out the range, mode, median, and mean of this data. Discuss how you could use this information to make a prediction about the weight of the eleventh box. Have students complete Part 1 of their activity page, and then weigh the box to check their predictions. Don’t open the box until after Part 2. 5. Predict and Graph Total Candies Repeat the same procedure for Part 2 - Total Candies. Students should make predictions about the total number of candies in their boxes, and then should open the boxes and count them. Following the directions on their worksheets, they can chart and graph the class results. Finally, they should make predictions about the total number of candies in the unopened box and explain their reasoning. 6. Explore Color Variations To begin the last part of the activity, ask students if all boxes have the same number of hearts of each color. Have them create a tally chart of their data and then graph it in another way. Ask them to explain why they used that particular graph for their data. While they are doing this, ask them to come up in pairs to add their data to the class data chart described in the materials list. This chart needs to be large enough so that all students can see the class results. Discuss the class results using questions such as: Which color occurs most frequently in each box? Is this color the same color in all boxes? What is the range of orange hearts? Pink hearts? What is the median number of white hearts? Yellow hearts? What is the mode of green hearts? Orange hearts? What is the mean number of pink hearts? White hearts? Is the total number of hearts related to the weight of the box? To wrap up the activity, return to the original question that you posed at the beginning of the investigation. How similar and different are boxes of valentine heart candies? Ask students to compare the data and write about the patterns they noticed. | ||
|
 Laura Candler, author of 10 books for teachers and teaching veteran of more than 27 years, teaches 4th grade teacher in Fayetteville, North Carolina. She has presented educational workshops to teachers around the country for over 12 years.